
Sales Productivity Software
Sales productivity software helps a dealership see where leads are won or lost and what to fix next. It records lead response, follow-up, appointments, and deal progress in one system, so the numbers behind your sales effectiveness are consistent and easy to read. The metrics worth tracking fall into four groups: funnel conversion, profitability, inventory movement, and customer retention.
This guide explains each group with formulas, a worked example, and a diagnostic table. It then shows how sales productivity software supports those metrics and how to evaluate your options.
What Sales Productivity Software Does for a Dealership
Sales productivity software is a category of tools that help sales teams spend less time on admin and more time selling. In a dealership, it usually appears as a CRM or lead management platform, often with messaging, calling, scheduling, and reporting built in.
Its main value for management is visibility. When every lead, call, appointment, and deal is logged in one place, you can measure each stage of the sales process instead of guessing. Software cannot create good sales habits by itself, but it makes performance measurable, and that is the first requirement for improving it. The sections below cover what to measure; a later section maps each metric to the software features that support it.
What Are Car Dealership Sales Effectiveness Metrics?
Car dealership sales effectiveness metrics measure how efficiently a store turns customer interest into appointments, sales, profit, and repeat business. They answer questions such as:
- Are new leads contacted quickly?
- Do enough leads become appointments?
- Do booked customers show up?
- Does the showroom convert visitors into buyers?
- Is each sale profitable?
- Is inventory moving at a healthy pace?
- Do past customers return?
Unit sales alone cannot answer these. A store can sell more cars while earning less per deal, answering leads slowly, or letting aging stock tie up cash.
Leading and Lagging Indicators
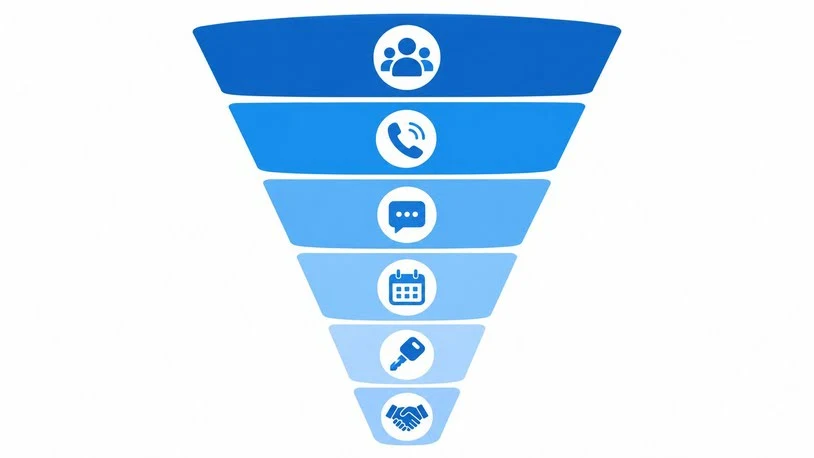
Metrics fall into two types. Leading indicators, such as response time, contact rate, and show rate, move before the sale is decided, so managers can act on them mid-month. Lagging indicators, such as units sold, gross profit per vehicle, and cost per sale, report what already happened. Use leading indicators as early warnings and lagging indicators to confirm that a change worked.
Key Dealership Sales Metrics at a Glance
| Metric | How to calculate | Question it answers |
| Lead response time | Time of first personal reply − time lead arrived | How quickly do we respond? |
| Lead contact rate | Leads reached ÷ total leads × 100 | Can we reach the people who inquire? |
| Lead-to-appointment rate | Appointments set ÷ total leads × 100 | Do conversations produce a next step? |
| Appointment show rate | Appointments kept ÷ appointments set × 100 | Do booked customers arrive? |
| Appointment-to-sale rate | Sales from kept appointments ÷ kept appointments × 100 | Does the showroom close? |
| Lead close rate | Sales ÷ total leads × 100 | How well does the whole funnel convert? |
| Gross profit per vehicle | Total vehicle gross ÷ vehicles sold | Are we earning on each deal? |
| F&I revenue per vehicle | Finance and insurance revenue ÷ vehicles sold | How strong is the back end? |
| Cost per sale | Defined sales and marketing cost ÷ vehicles sold | What does each sale cost to win? |
| Inventory turn | Vehicles sold in period ÷ average inventory | How fast does stock cycle? |
| Days to sale | Sale date − date vehicle entered inventory | How long do cars sit? |
| Repeat customer rate | Repeat buyers ÷ eligible past customers × 100 | Do customers come back? |
No benchmark fits every dealership. New and used departments behave differently, lead sources vary in quality, and stores define funnel stages in their own ways. Build an internal baseline first, then compare similar periods, departments, and sources.
Lead and Funnel Metrics
These metrics trace a customer from first inquiry to showroom outcome. This is the stretch of the process where opportunities can stall, so it rewards close attention.
Lead Response Time
This is the gap between a lead arriving and the first meaningful reply from a person. An automatic acknowledgment does not count, because the customer still has no answer. Online shoppers can easily inquire with more than one dealership, so a fast, helpful reply gives you an advantage. Track the average, but also the slowest responses and after-hours leads, since averages hide the worst gaps.
Lead Contact Rate
Contact rate shows how many leads you actually reach. If it is low while lead volume is healthy, the problem is probably handling rather than demand. Typical causes are incomplete contact details, too few attempts, the wrong channel mix, or unclear ownership.
Lead-to-Appointment Rate
Reaching a customer is not enough; the conversation needs a clear next step. If contact rate is strong but appointments are weak, review how your team answers questions, handles objections, and proposes a specific time.
Appointment Show Rate
Show rate is the share of booked appointments that actually happen. A low figure usually points to the gap between booking and arrival: no confirmation, no reminder, or no useful information sent ahead of the visit.
Appointment-to-Sale Rate and Lead Close Rate
Appointment-to-sale rate measures showroom performance, while lead close rate measures the whole funnel. Comparing them tells you where to coach. A strong showroom rate with a weak overall close rate suggests the front of the funnel needs work, and the reverse points to the sales floor.
Profitability and Cost Metrics
Volume without margin is a weak result. These metrics keep the profit picture honest.
Gross profit per vehicle. Divide total vehicle gross by units sold, and track new and used separately. A falling figure alongside rising sales can signal heavier discounting or a weaker vehicle mix.
F&I revenue per vehicle. Finance and insurance products are a meaningful profit source for many stores. This metric shows whether the back end keeps pace with front-end volume.
Cost per sale. Cost per lead can look cheap while cost per sale tells a different story. Divide your defined sales and marketing cost by vehicles sold, and compare by lead source.
Source-level performance. Track lead volume, conversion rate, and cost per sale for each channel, such as listing sites, your own website, social campaigns, and walk-ins. A channel that sends fewer leads but sells more of them can outperform a high-volume channel that rarely converts.
Inventory and Online Visibility Metrics
Inventory is one of a dealership’s largest investments, and every extra day a unit sits adds holding cost, depreciation risk, and tied-up cash.
Inventory Turn
Inventory turn shows how many times you sell and replace stock in a period. There are two common versions: unit-based (vehicles sold ÷ average inventory) and cost-based (cost of goods sold ÷ average inventory value). Choose one and stay consistent. For example, a store that sells 480 vehicles a year while holding an average of 60 turns its inventory 8 times a year.
Days to Sale and Stock Age
Days to sale is the time from a vehicle entering inventory to being sold. Stock age shows how long currently unsold units have been on the lot. Eight turns a year implies roughly 46 days on average (365 ÷ 8). Watch the trend: a rising average can point to pricing, weak listings, or stock that does not match local demand.
Balancing Profit and Speed
Holding out for maximum margin can leave cars sitting, while discounting too fast gives profit away. Reading gross profit per vehicle next to days to sale shows whether your pricing is balanced.
Online Visibility: Time to Market and Listing Engagement
A car cannot sell until shoppers can see it. Two metrics cover this stage:
- Time to market: the time from acquiring a vehicle (or finishing reconditioning) to publishing it online with photos and a description.
- Listing engagement: views, time on page, and inquiries per vehicle listing, taken from your website or listing-site analytics.
If listings get traffic but few inquiries, look at photos, pricing, and vehicle details before blaming lead handling.
Customer and Team Metrics
Repeat customer rate. Define the eligible group clearly, such as buyers from the past two to five years, and measure how many return. Repeat business can cost less to earn than new customers, but check that against your own acquisition costs.
Customer satisfaction and Net Promoter Score. Customers rate their likelihood of recommending you from 0 to 10. The score is the percentage of promoters (9–10) minus the percentage of detractors (0–6). Read the written comments too, because they often explain the number.
Sales per salesperson. Total sales divided by active salespeople gives a productivity snapshot. Use it for coaching rather than ranking, and compare people on similar lead types, since weaker leads naturally convert less.
How to Diagnose the Sales Funnel
One metric rarely explains a problem on its own. Read related numbers together.
| What you are seeing | Start by checking |
| Plenty of leads, few real conversations | Response speed, number of attempts, lead routing, accuracy of contact details |
| Conversations happen, but few visits get booked | How reps respond to questions and suggest a specific time |
| Visits get booked, but customers do not arrive | Confirmations, reminders, information sent before the visit |
| Customers arrive but do not buy | Needs discovery, vehicle availability, pricing, trade-in handling |
| Unit sales rise while margin falls | Discounting, vehicle mix, pricing consistency |
| Cars sit longer before selling | Pricing, listing quality, time to market |
A Worked Example
The figures below are illustrative, not industry benchmarks. Suppose a store receives 400 leads in a month:
- 300 are contacted (75% contact rate)
- 120 become appointments (30% of leads)
- 78 appointments show up (65% show rate)
- 26 shown customers buy (about 33% appointment-to-sale rate)
The overall lead close rate is 26 ÷ 400 = 6.5%. The weakest stage looks like the show rate, since 42 booked customers never arrived. Improving confirmations may be a more efficient place to start than buying more leads. Reasoning like this requires stage-by-stage data, which is what sales productivity software is meant to provide.
How Sales Productivity Software Improves These Metrics
Dealership data often sits in several places: a CRM, a dealer management system, an advertising dashboard, a phone system, and spreadsheets. When each team keeps its own version, the numbers disagree and trust in reports erodes. Software connects specific features to specific metrics:
- Response time and contact rate: instant lead alerts, clear ownership, and reminders for overdue follow-up.
- Appointment and show rate: built-in scheduling, automated confirmations, and reminders.
- Close rate and coaching: conversation history and deal stages that managers can review.
- Cost per sale: lead source tracking tied to final outcomes.
- Retention: records of past customers and prompts to stay in touch.
Closing Communication Gaps Between Departments
Many lost deals trace back to handoffs, not the sales pitch. A BDC agent books a visit but the salesperson never sees the notes. A trade-in appraisal waits with the used car manager. F&I learns a customer’s budget too late. A shared platform with one customer record keeps that history visible to everyone who touches the deal, which narrows these communication gaps.
A RevOps Mindset for Dealerships
Revenue operations software and the RevOps approach come from software and B2B sales, but the idea transfers well. RevOps aligns sales, marketing, and service around shared definitions and shared data. For a dealership, that means agreeing on what counts as a lead and an appointment, assigning an owner to each funnel stage, and measuring everything against those definitions.
Choosing the Best Sales Productivity Software to Close Deals Faster
The best sales productivity software to close deals faster is the one your team will actually use and that reports the stages you care about. Instead of chasing a ranked list, test each candidate against these questions:
- Does it report your funnel stages? Response, contact, appointment, show, and sale should each be measurable.
- Does it integrate with your DMS, website, and lead sources? Manual re-entry causes delays and errors.
- Can you segment reports? You need views by salesperson, source, new versus used, and period.
- Is it practical on the floor? Mobile access and quick logging decide whether staff keep it updated.
- Does it support follow-up quality? Templates, reminders, and conversation history matter more than raw activity counts.
- How strong are onboarding and support? Adoption is where most rollouts succeed or fail.
- What is the total cost? Include setup, per-user fees, add-on modules, and training time.
Types of Sale Software Products
Different sale software products solve different problems:
- CRM and lead management for follow-up and pipeline tracking.
- Dealer management systems (DMS) for deals, accounting, and inventory records.
- Messaging and calling tools for faster outreach.
- Merchandising and listing tools for presenting vehicles online.
- Business intelligence tools for custom reporting.
Some platforms combine several of these. Decide which gap hurts most before comparing vendors. Software also has limits: it will not fix unclear definitions, weak coaching, or a pricing problem.
How Often to Review Dealership Sales Metrics
Match the rhythm to how quickly your team can respond.
| Frequency | What to review | Purpose |
| Daily | New leads, response times, contact attempts, appointments set and kept, customers awaiting follow-up | Catch problems while they can still be fixed |
| Weekly | Conversion by salesperson and source, aging opportunities, stock movement | Spot patterns a single day hides |
| Monthly | Units sold, gross profit and F&I per vehicle, cost per sale, inventory turn, days to sale | Judge results and pricing balance |
| Quarterly | Repeat customer rate, satisfaction scores, metric definitions and baselines | Check retention and reset targets |
Common Mistakes When Tracking Sales Effectiveness
- No owner for each metric. A number nobody is responsible for rarely improves.
- Unclean data. Duplicate leads, missing source tags, and inconsistent stage definitions make comparisons unreliable.
- Reading too much into small samples. A week with few leads can swing a percentage sharply without meaning anything.
- Ignoring lead mix. Compare like with like; a rep working weaker lead sources will convert fewer.
- Counting activity instead of outcomes. More calls and texts do not guarantee better conversations or more appointments.
- Buying software before defining the process. A tool will only automate whatever process you give it.
- Changing several things at once. You cannot tell which change worked.
Five Steps to Build a Dealership Sales Dashboard
- Define your funnel stages in writing: lead, contact, appointment, show, sale.
- Pick 8 to 12 metrics across funnel, profit, inventory, and retention.
- Clean and standardize your data, including lead source tags and duplicate records.
- Record a baseline across several comparable periods and assign an owner to each metric.
- Fix the biggest drop-off first, make one change, and measure again.
Frequently Asked Questions
What is sales productivity software?
It is software that helps sales teams manage leads, follow-up, scheduling, and reporting in one place, so they spend less time on admin and can see which activities lead to sales.
What are the most important KPIs for a car dealership?
Common priorities include lead response time, contact rate, lead-to-appointment rate, show rate, appointment-to-sale rate, gross profit per vehicle, cost per sale, inventory turn, days to sale, and repeat customer rate. The right mix depends on your process and goals.
How do you measure car dealership sales effectiveness?
Follow customers through the funnel from lead to contact, appointment, visit, and sale. Then pair those conversion rates with profit and inventory metrics so higher volume cannot hide weaker margins or slow-moving stock.
What is a good closing rate for a car dealership?
There is no universal figure. Rates vary by lead source, department, market, and how you define a lead. Set an internal baseline and compare similar lead types over similar periods.
What is the difference between lead close rate and appointment-to-sale rate?
Lead close rate compares sales with all leads. Appointment-to-sale rate compares sales with customers who actually showed up. Using both shows whether conversion breaks down before or after the visit.
Is revenue operations software relevant to car dealerships?
RevOps is more of a working approach than a single product. Dealerships can borrow its principles, such as shared definitions and shared data across sales, marketing, and service, even if they run on an automotive CRM or DMS.
Do small dealerships need sales productivity software?
Not always at the start. A small store can track a few core metrics in a spreadsheet. Software becomes more valuable as lead volume, staff, and data sources grow and manual reporting starts producing errors.
Conclusion
Car dealership sales effectiveness metrics are most useful when they point to a clear next action. Track the funnel from first response to sale, connect volume with profit and inventory, and review results by the segments that matter in your store.
Sales productivity software makes that discipline easier to keep, because it puts reliable data in front of the people who can act on it. The gains still come from consistent definitions, clear ownership, and following through on what the numbers show.

James Anderson is a sales professional focused on helping businesses improve their sales process and achieve better results. He is experienced in using sales tool to manage leads track customer interactions identify opportunities and support business growth. William values clear communication strong customer relationships and efficient sales strategies.